Two records, one comparison
SURMOUNT-1 studied adults with obesity or overweight without diabetes over 72 weeks; SURMOUNT-2 included type 2 diabetes. Trial treatment was weekly subcutaneous tirzepatide or placebo.[1]
A question about measured change becomes more demanding when it also asks about experience. How much changed, what someone felt, and whether one explains the other are different questions. A useful reading begins by identifying the observation needed for each. Otherwise, a result that answers the first question can acquire an explanation simply because a second measurement appears beside it.
Consider what a comparison is supposed to accomplish. Describing an association asks how recorded characteristics appear together. Estimating an effect asks what would differ under alternative interventions. The latter requires a defensible comparison between possibilities, beyond a description of the people who happened to have a particular experience. Choosing between these questions changes the argument needed to support an answer.
The unit of reasoning also matters. A statement about a group can be informative without describing any particular member. To move from a group result to an account of an individual's course, the analysis would need information that preserves individual differences and their sequence. This is a change in the scientific task, rather than a more personal wording of the same conclusion.
Reading with those distinctions in mind makes the summaries useful on their own terms. First identify the measurement and its reference point. Then ask what the chosen summary preserves. Only after that should the explanation connect the measurements. This order keeps an attractive account of why change occurred from deciding, in advance, what the observations must mean.
What a group label erases
Post-hoc groups used any nausea, vomiting or diarrhea report; symptom status was not randomized.[2]
A yes-or-no label answers an existence question: did the defining condition occur within the relevant observation period? Its economy is useful because it produces a clear grouping rule. But the same economy removes detail. Once a record has crossed into the affirmative category, further information need not change that label, even when it would change the question a reader wants answered.
For an experience-based question, the distinctions might include a brief interval versus an extended one, or an occurrence before rather than after a particular measurement. These are possible dimensions of a richer description, not accounts of what happened to participants. Their importance depends on the purpose of the comparison. Duration would matter to a duration question; ordering would matter to an explanation that requires one event to precede another.
A category can therefore be defined consistently and still be insufficient for a broader purpose. Consistency concerns whether the rule is applied as intended. Sufficiency concerns whether the resulting information can answer the question. Rejecting a category merely because it is simple would miss its legitimate use. Treating its simplicity as a complete description would make the opposite mistake.
A reader can test the fit by asking which differences between records would leave the label unchanged. If those differences are central to the proposed interpretation, the label cannot settle that interpretation alone. This test does not require assuming collection errors or inventing unseen experiences. It identifies the information the question would require before judging any particular result.
What the average retains
SURMOUNT-1, 15 mg: least-squares mean baseline-to-week-72 changes were −22.8% with symptoms and −22.2% without.[2]
An average provides a position on a measurement scale. It does not supply a picture of how tightly individual values cluster, whether the distribution is uneven, or where its extremes lie. Those features require their own descriptions. Without them, the center remains informative, but a reader cannot expand that center into a complete account of the observations around it.
Different arrangements can share a central summary. A compact concentration and a broad spread need not announce their difference through that summary alone. Nor does a center identify the experience most frequently encountered. Asking what is typical therefore requires specifying what typical means: near a chosen center, common within an interval, or representative of a particular course over time. Those definitions need not select the same description.
Comparison introduces another layer. Numerical closeness is a feature of point estimates; equivalence is a claim that requires an acceptable difference to be defined and uncertainty to be assessed against it. A small-looking separation cannot supply either requirement. The scale also needs a purpose: a difference relevant to one question need not be decisive for another. Visual similarity is a starting observation, not a finished equivalence argument.
These distinctions guide what to seek next. To understand variation, look for a description that retains more than location. To assess precision, seek uncertainty for the intended contrast. To understand a course, seek measurements arranged through time. Each request adds a different kind of information. Collecting more summaries of the center would not automatically meet all three needs, and calculating an extra contrast would not create missing information about its uncertainty.
One cut through a distribution
ICH treats the population-level summary as a distinct part of the treatment-effect question.[3]
A threshold changes the question from where a summary lies to which side of a boundary an outcome falls on. That choice can be useful when crossing a specified boundary is itself the object of inquiry. It also makes the boundary part of the meaning of the result. A percentage without a clearly defined criterion would leave the classification rule unknown.
Within each side, however, distances disappear. Outcomes just past the boundary and outcomes far beyond it can receive the same classification. A threshold percentage therefore cannot show whether qualifying observations cluster near the cutoff or extend widely away from it. The same issue applies on the other side. This is a consequence of the summary's construction, not evidence that either pattern actually occurred.
Boundary choice deserves attention before comparing percentages. Moving a cutoff changes the classification question, even if the underlying observations stay fixed. A result at one boundary cannot reveal the result at every alternative boundary. Several thoughtfully chosen summaries could describe more of the distribution, but their usefulness would depend on which distinctions they preserve. More categories alone do not guarantee a more relevant answer.
The following display offers a reason to read a threshold alongside, rather than as a substitute for, a central summary. Ask what it counts, what reference defines success, and which comparison it belongs to. The percentage then has a precise job. It cannot become a probability for a particular person merely by replacing the group label with the word you.
The starting line was selected
SURMOUNT-4 randomized 670 eligible lead-in completers at week 36; 335 per arm continued tirzepatide or switched to placebo for 52 weeks.[4]
SURMOUNT-4 enrolled adults with obesity or overweight without diabetes; randomized participants continued their maximum tolerated 10 or 15 mg weekly injection or switched to placebo.[1]
Where a comparison begins determines which decision it can address. An intervention assigned after an earlier course asks about alternatives at that later starting point. It does not recreate the alternatives available before any exposure. The word placebo, by itself, cannot make those starting conditions interchangeable. Their meaning comes from the sequence in which the comparison is embedded.
An eligibility boundary also defines to whom the contrast directly pertains. If entry into a later comparison depends on reaching an earlier stage, the resulting question concerns those who reach that boundary under its rules. Extending an answer to people outside it would require a separate argument about relevance. That extension cannot be achieved simply by broadening the noun used to describe the study population.
The reference quantity needs equally careful treatment. Retaining a fraction of an earlier change uses that change as the reference. It differs conceptually from expressing an outcome relative to an original body measurement. It also differs from asking whether an activity continued or an experience persisted. These questions may sound similar in ordinary language, but each defines a different outcome and needs a different record.
Before interpreting a threshold display, then, trace its starting point, qualifying population and reference quantity together. The comparison is coherent only while those pieces stay connected. Importing the meaning of an earlier grouping into a later treatment contrast would change the question without changing the labels on the page. Keeping the comparisons separate allows each to contribute information without pretending that their categories line up.
A threshold view
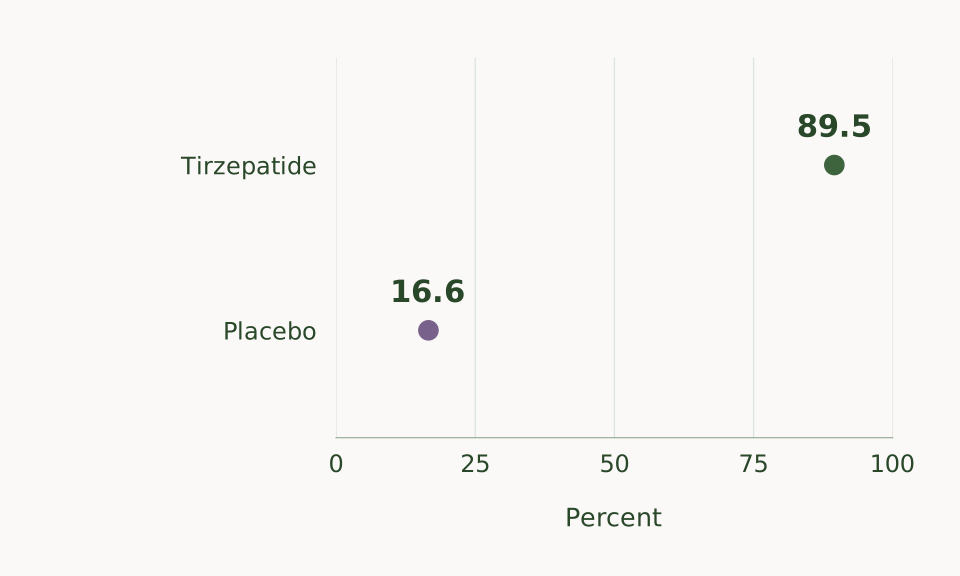
Read the chart as a table
| Assigned group | Percent |
|---|---|
| Tirzepatide | 89.5 |
| Placebo | 16.6 |
Which measurements remain
Weight observations after stopping treatment were excluded; SURMOUNT-2 also excluded measurements after antihyperglycemic rescue.[2]
The program's treatment-regimen estimand includes outcomes regardless of treatment discontinuation.[1]
An observation can be available and still fall outside the question an analysis is designed to answer. Availability is a property of the record; relevance follows from the analytical target. By contrast, an outcome that belongs to the target but was not observed creates an information problem. Treating both situations as simply absent data would conceal why a value is missing from a particular calculation.
A clear target makes that distinction inspectable. It specifies the outcome of interest and how events along the way enter the question. The next task is to determine what observations support that target and what assumptions bridge any gap. An answer can be mathematically precise while addressing a different target from the one a reader intended. Precision does not repair that mismatch.
Changing an observation rule could change the collection of values considered, their timing, or the interpretation attached to the estimate. None of those possibilities establishes the direction of a resulting difference. To make a directional claim, one would need evidence about the relevant outcomes and the estimation procedure. The name of a rule alone cannot tell a reader that a result became larger, smaller or more favorable.
This is why comparing analytical approaches requires more than checking whether their numbers agree. Agreement could coexist with different questions; disagreement could reflect a deliberate change in the question. The first task is to align the targets. Only then can numerical agreement or disagreement become evidence about the sensitivity of an answer.
Summaries do not join the records
Separate summaries do not preserve the links between records. Knowing how one variable is distributed and how another is distributed does not, by itself, identify which values belong together. Many pairings can be compatible with the same separate summaries. An explanation about how experiences and outcomes connect needs information about those pairings, beyond a fuller description of either variable alone.
Pairing would make a new question available: whether particular combinations occur together within the unit being studied. That is already more specific than comparing two independent descriptions. Yet a paired endpoint would still leave a temporal question open. The same final pairing could be reached through different sequences, and an explanation that depends on order would need to distinguish those sequences.
A defined interval helps specify the temporal comparison. The investigator would need to say which observation comes first, which later outcome it is being related to, and how intervening information enters the analysis. Changing that interval could change the question even with the same people and measurements. A time stamp becomes scientifically useful through its role in a defined comparison, rather than merely through its presence in a record.
None of this requires assuming that an underlying study lacks detailed data. It distinguishes what a displayed summary communicates from what a richer dataset might permit. The appropriate next request is for an analysis that preserves the links required by the explanation. Reconstructing those links from separate percentages or centers would replace an unanswered question with an unsupported arrangement of the records.
A mechanism needs another argument
Exploratory mediation covered SURMOUNT-1–3, estimating a share of the treatment effect.[2]
A causal explanation asks what would happen if a proposed intermediate process changed while the relevant comparison conditions were specified. That is more demanding than observing that two features occur together. A group difference can motivate the explanation, but the explanation needs assumptions connecting the observed records to an alternative course that cannot be directly observed for the same person at the same time.
Ordering is one part of that argument. A proposed intermediary needs a temporal position that makes the claimed direction possible. Measurement definition is another: changing the definition could change what process the analysis represents. Common causes would matter if they influenced both the intermediary and the later outcome. These are conditional requirements for a causal interpretation, not claims that a particular alternative explanation occurred.
Decomposing an effect also introduces a reference quantity. A share of an estimated contrast describes a relationship between parts of that contrast. It does not express the same thing as a change on the original outcome scale. Moving between those quantities would require an explicit calculation and its assumptions. Merely preserving a percent sign would not preserve the meaning of the result.
A useful challenge to a mechanism is therefore to identify which assumption carries the explanatory work. If an alternative ordering or measurement definition were credible, would the causal account remain defensible? If a common cause were plausible, what would be needed to distinguish its influence? These questions focus scrutiny on the transition from description to explanation. A more elaborate statistical calculation cannot, by its complexity alone, establish that the transition is justified.
Testing the explanation
Lilly funded the analysis; six authors were employees and shareholders.[2]
Lilly sponsored the withdrawal trial and participated in its design, conduct, analysis and reporting.[4]
Transparency makes different parts of an argument open to different checks. A reader can examine whether a measurement matches its definition, whether the calculation targets the intended question, and whether the interpretation goes beyond that target. These checks should remain distinguishable. Agreement at one step does not automatically validate the next, and a disclosure does not itself supply a numerical correction to an estimate.
Reproducing an output from the same inputs and rules tests whether that output follows from the specified calculation. Independent replication asks whether an appropriately comparable investigation supports the finding again. Neither task can be replaced by a confident explanation. Stating which task has been completed makes the resulting confidence more intelligible than treating every form of verification as interchangeable.
For a separate examination of timing, read the companion analysis of follow-up. Information about this publication belongs to the publisher context. Keep that context distinct from the evidence needed to evaluate a scientific explanation. The strength of an inference should remain traceable to its measurements, comparison and assumptions.
Keeping outcomes and care separate
Zepbound is contraindicated with personal or family medullary thyroid carcinoma history, multiple endocrine neoplasia type 2, or prior serious hypersensitivity to tirzepatide or product ingredients. Use is not recommended with severe gastroparesis. Persistent or severe abdominal pain needs prompt assessment; gastrointestinal fluid loss can injure kidneys. Gastric emptying is delayed.[5]
Compounded GLP-1 products are not FDA-approved.[6]
A scientific summary helps frame an evidence question; it cannot make an individual care decision. Use the peptide reference library for reference navigation and the CoreAge Rx service review to examine dated service documentation. Keep questions about a service separate from questions about an effect. Reading the two together does not create evidence that connects a particular provider to a trial result. A useful next conversation can specify which question remains unresolved without turning the article into a personal treatment plan.
Reader questions
Can similar averages establish the same experience?
No. An average addresses location, while an experience may involve variation and sequence. A useful follow-up is to name the particular difference that matters, then seek a summary capable of retaining it. Asking about spread, a qualifying range or a course over time calls for different information. Agreement on a central estimate does not answer all of those questions simultaneously.
What does a threshold percentage add?
It makes a specified boundary the focus of the question. That can clarify an endpoint when the criterion has a defensible purpose. To interpret the answer, keep the criterion attached to the percentage and identify what remains hidden within each category. If the concern is how far outcomes extend, a classification at one boundary is insufficient; information about distances would be needed.
What would strengthen a proposed symptom mechanism?
A stronger argument would connect clearly defined measurements within a defensible temporal sequence and explain why the proposed causal comparison is credible. It would also identify assumptions that could be challenged, rather than treating association as its own explanation. An informative challenge would ask whether plausible alternative definitions, orderings or common causes change the interpretation. Additional detail helps when it addresses those specific uncertainties.
What to take from the evidence
Describing change, describing its distribution and explaining its cause are distinct scientific tasks. A good summary can make the first task more precise while leaving the others open. A useful assessment therefore identifies the question that has advanced and the information still needed for the next one. This preserves the value of a limited answer without stretching it into a broader claim. The most informative next analysis would be chosen for the uncertainty it resolves. More detail about variation would address a distributional question. Linked observations through time would address a question about sequence. A causal explanation would additionally require a defensible comparison and explicit assumptions. Progress comes from matching evidence to those requirements, not from accumulating increasingly elaborate summaries that leave the central question unchanged.
Scope of this article
This article interprets published research and statistical questions; it does not reanalyze individual participant records or provide a clinical assessment. Its discussion of alternative distributions and causal assumptions identifies information a question would require, rather than asserting that those alternatives occurred. The figure and cited statements retain their stated analytical scope.